Regional Economic Database
Over 1900 regions, 115 BAK individual sectors and comprehensive indicators
The extensive database consists of different core elements: 1900 regions, 115 BAK individual sectors, 200 sector aggregates, 24 performance indicators and wide-ranging locational factors. The advantage of the database solution lies in the flexibility of the application and evaluation – all indicators, regions and sectors can be flexibly combined or compiled anew. Evaluations are possible for a total of 20 years, up to the respective current year. This means fundamental trend impacts as well as current developments in your region as well as in your competing and benchmark regions can be depicted. The system can be extended to include additional coun-tries, regions, sectors and indicators, as required.
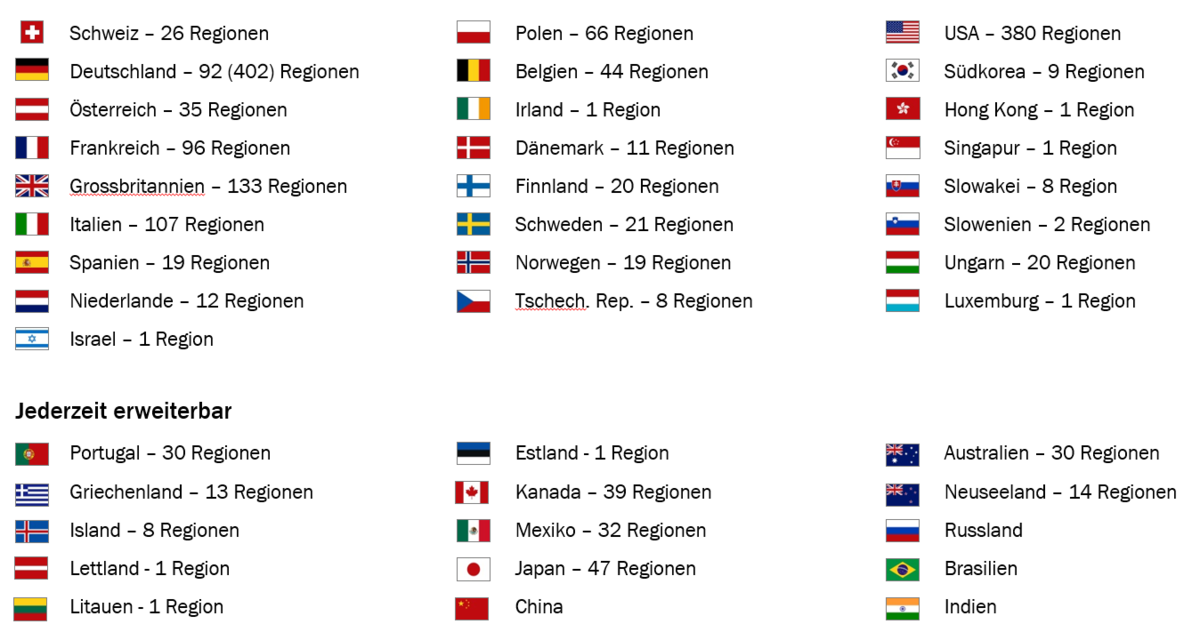
Over 1900 regions
Choose from internationally comparable regional data on the economic performance and locational attractiveness of 1900 regions in 25 countries. In most countries, the regions are available at the TL3/NUTS3 level. In major countries such as Great Britain and Germany, the dif-ferentiation corresponds to the counties or rural districts. In the USA, the Metropolitan Statistical Regions are available (a total of 380 regions, and 35 regions within California). The de-tailed regional structure provides the basis for the analysis. Comparisons can be made at any aggregated level, in order to compare regions on a level playing field. If necessary, the regional analysis level can be deepened even further, and additional countries can also be added.
Comprehensive indicator sets for in-depth analysis
The centrepiece of the database represents the indicators for regional economic performance, which enables the economic strength and potential to be evaluated. When it comes to future developments, another decisive factor is locational quality. This can be measured using a wide variety of indicators – many objective, some subjective. We provide you with a comprehensive set of indicators for the key locational factors. Depending upon the particular requirements, this package can be used to depict the strength of the region relative to competing regions, or to identify in-house weaknesses for internal strategic processes. The advantages of your regions can be effectively communicated in a fact-based manner to companies that are considering relocating.
115 BAK individual sectors
The economic structure is the basis for regional prosperity, and is therefore the key to its future development. For this reason, analysis of the future prospects of your regional economic structure is the basis for all strategic measures. BAK offers you the largest possible variety of sectors and far-reaching flexibility in terms of their composition, in order to depict and to record the regional economic structure as realistically as possible. In overall terms, the economic structure of each region can be differentiated using 115 specially defined individual sectors. The manufacturing industry consists of 70 sectors (NACE 3 places), while the service industry is divided into 30 sectors (2 places). 3 place and 2 place sectors can be combined in any way desired – including on an interdisciplinary basis.