Smart Specialisation Consulting
The BAK Smart Specialisation Association was founded to bundle the interest of experts and interested parties in intelligent specialisation strategies. Here you can find the website of the BAK S3 Association.
S3 analysis in a nutshell: regional strategic support
A strategic economic development for your region – well-founded, evidence-based und scientifically supported
Are you responsible for the strategic economic development in your region and need a solid foundation to base your decisions on? Are you looking for a tailor-made advisory service which is based on a general innovation policy approach?
The concept of Smart Specialisation Strategy (S3) aims to support your region to improve its strategic economic development. Regarding the Smart Specialisation of your region, characteristics and assets unique to your region are identified to diagnose the economic potential of your region. Smart Specialisation requires comprehensive knowledge of the region and the regional economy as well as a sound methodology and process to design and implement a Smart Specialisation Strategy for your region. This process with its excellence-driven vision of the future strengthens your regional innovation system and eventually the entire regional economy.
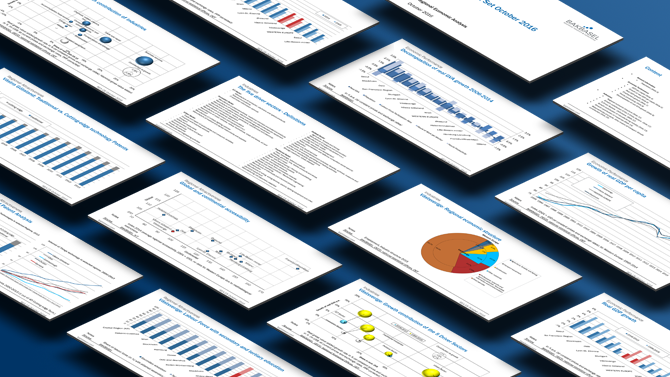
Our experts have compiled a stepwise process necessary for the design of your Smart Specialisation strategy and its successful application. Summarised in a compact chart set, all evidence-based steps to develop such a strategy for you are derived. In order to give you an overview of our suggested stepwise process, the BAK S3 chart set begins with a visualisation of a standard Smart Specialisation process.
The first step of the process develops a precise definition of your region. It can reach from a basic map to a detailed analysis of different test regions. In the second step, we develop the base of evidence which forms the foundation of any S3. Moreover, we conduct an international benchmarking comparison of your region with a selected group of peer regions to assess your region’s position within the international market. Within this framework, the following areas are analysed:
Economics performance according to different indicators and methods (population development in your region, GDP per capita, GDP growth, jobs and job creation, population growth, decomposition of growth).
Industrial focus according to sectoral contributions to GDP growth; we distinguish between basic industries, service sectors and other key industries identified in your region, based on up to 115 individual industries which are covered in the Regional Economic Database.
Competitiveness in terms of regional export-oriented sectors their productiveness and national labour costs.
Location quality in terms of different location factors (i.e. accessibility, taxes, regulation, skilled labour force).
Innovation capacities in terms of selective indicators as for example R&D expenses, quality of the universities and their integration in your region as well as patents.
We offer an additional option next to the international benchmarking. A detailed analysis of the economic structure of your region (analysis of sectoral-based added value and employment development) can be conducted. The results of this in-depth analysis are summarised in a strengths-weaknesses-profile. Furthermore, all charts contain a comment on the method used and the definition and explanatory power of the different indicators. Also, it includes a reading assistance to the graphic representation.
S3 chart set, includes:
- Methodical classification
- Definition of your Region
- Evaluation of the regional economic performance compared to 12 international peer regions (individually selected) and sample average
- Evaluation of the regional economic structure in an international framework
- Analysis of the regional competitiveness
- Identification of the location quality of your region
- Comparative analysis of the innovation potential of your region
- In-depth analysis of the regional economic structure (otpional)
- Strengths-weaknesses-profile of your region (otpional)
- Chart-based illustration of the findings
- Methodical explanation of the charts (explanatory power and definition of the indicators and reading assistance)
- Incl. documentation (regions, indicators, references)
- A total of 30-35 charts in PowerPoint
- All data and charts in Excel